Seabed hardness
Determining the nature of the seabed from single-beam echo sounder returns is a frequent request from users, in charting as in fishing. The Olex “echogram and seabed hardness” option partly meets it.
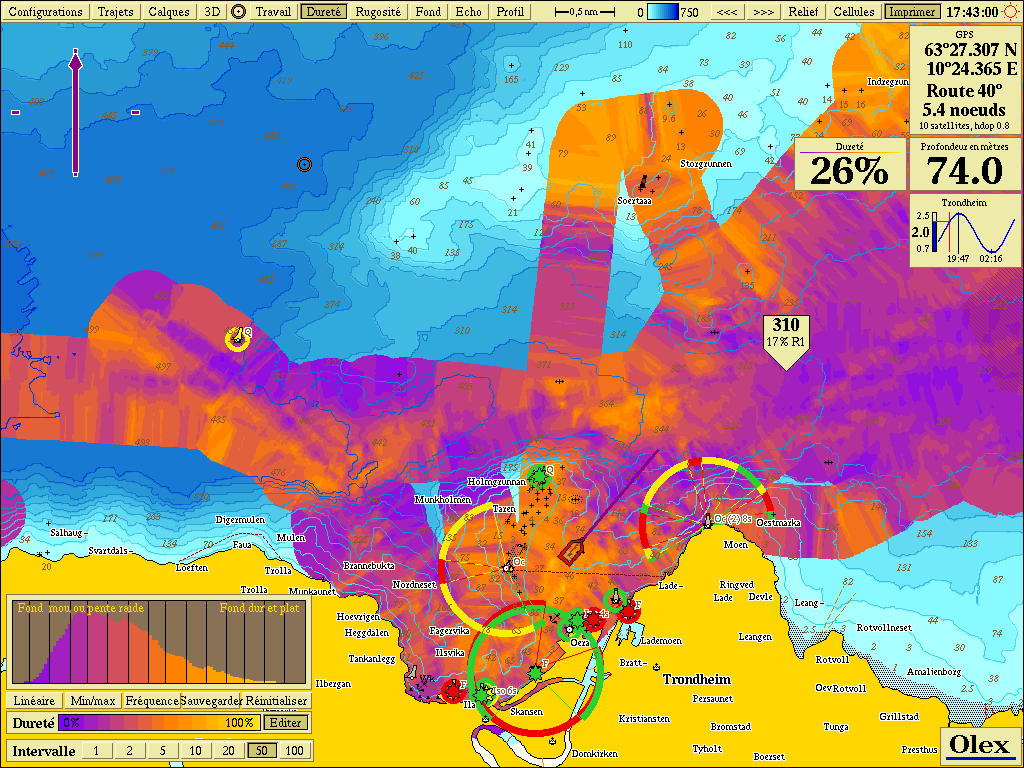 An idea of the nature of the seabed
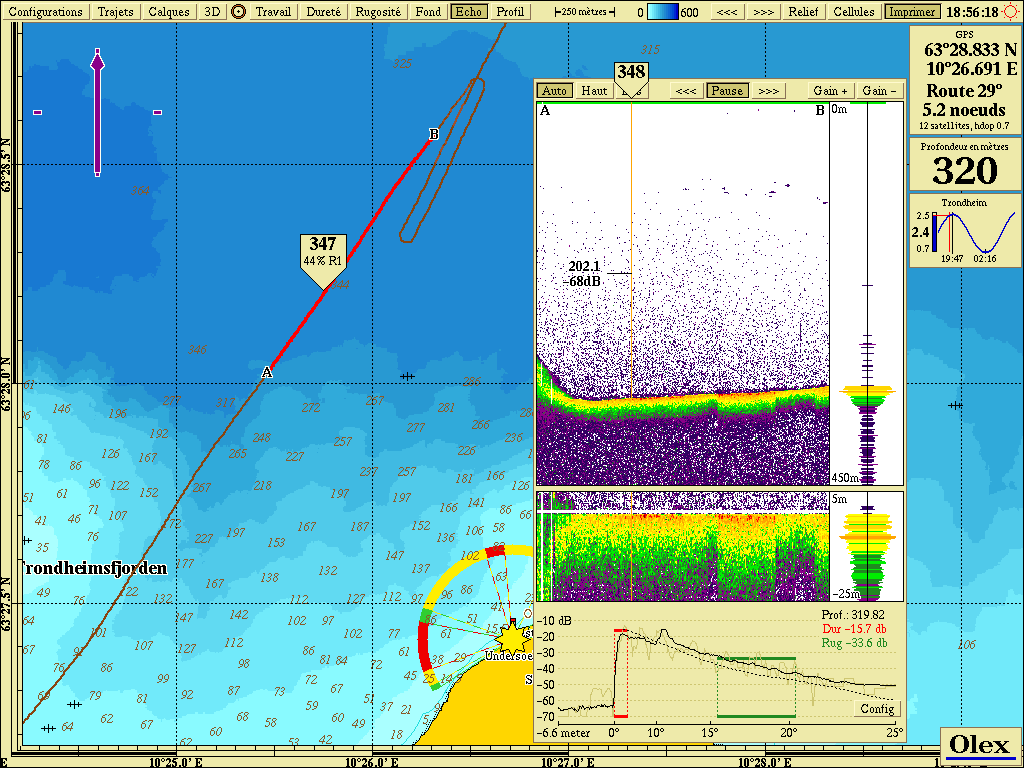 The link between the echo sounder image and the track’s position on the chart
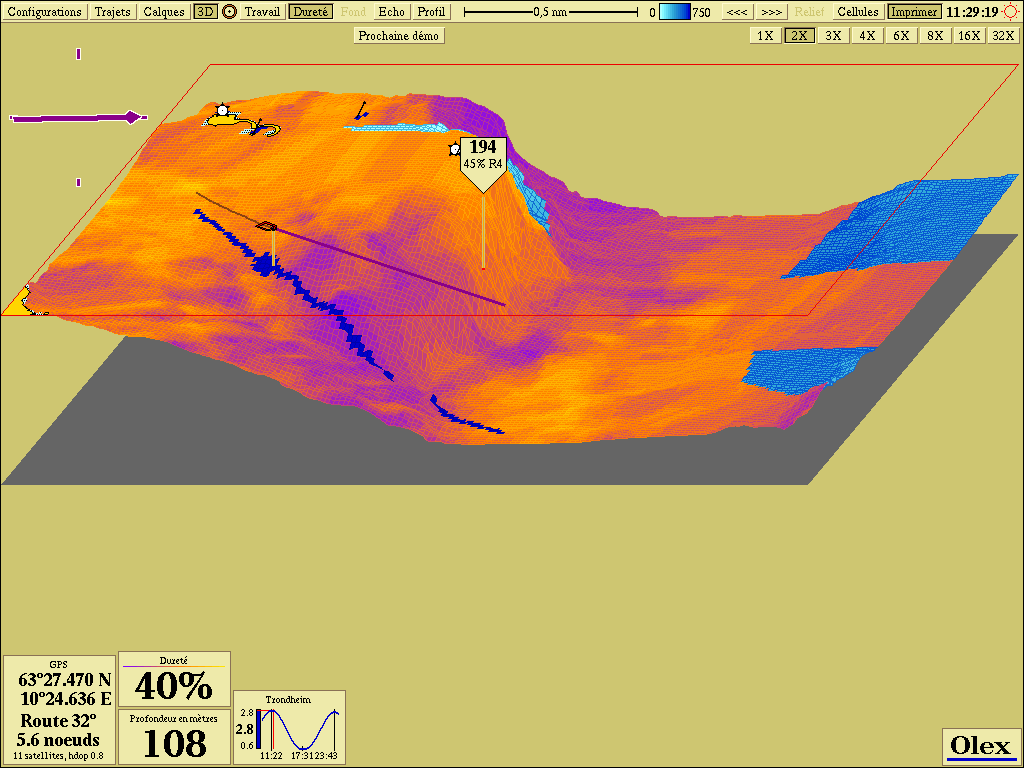 An even more realistic 3D view
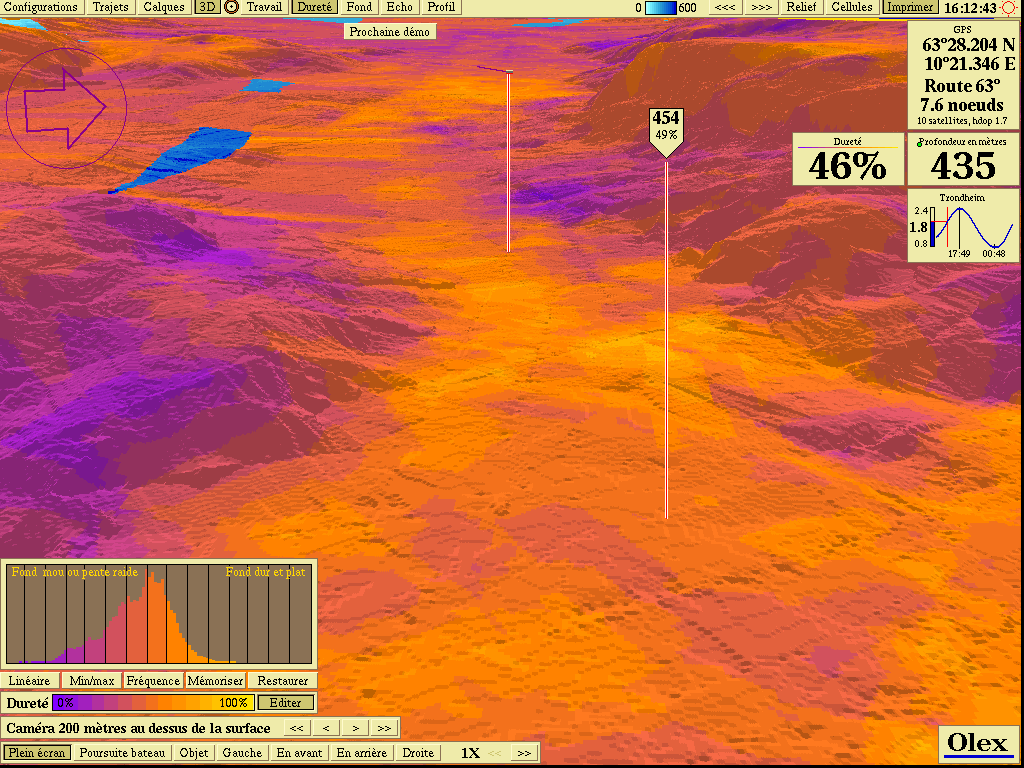 Another 3D view, fly-through mode
A complex problem
Xavier Lurton (Ifremer) sums it up as follows: most of the information lies in the time envelope of the echoes, whose shape reflects the angular sweep of the seabed by the signal and some of the seabed’s backscatter characteristics. But signals received in a narrow sector around the vertical are poorly suited to extracting parameters that characterise the seabed type: the possibilities are much smaller than with wide-sweep systems (side-scan sonars, multibeam echo sounders). The classification method compares the main echo with the first multiple echo: the tails of these two signals give a pair of parameters, the seabed roughness and its impedance contrast.
Simrad digital echo sounders (EQ60, EQ60BB, ES60, EK60, ER60, EY60, EA400, EK500, EA500, EY500, EA600) store the acquired, referenced data digitally, which lets Olex post-process it. With the option, Olex records reflectivity measurements (amplitude of the reflected signal) in addition to depths.
Olex only gives an idea of the hardness and roughness of the seabed. Determining the seabed type (sand, mud, rock…) remains too unreliable: an echo sounder properly calibrated over test areas can recognise the seabeds it meets, but only in conditions close to those of its calibration. This is unrealistic in situations as varied as those met in fishing.
Hard or soft seabed?
When connected to a Simrad Ex60 echo sounder (whose split-beam technique stabilises and evens out the beam, making surveys more accurate), Olex adds two seabed parameters to its real-time bathymetry:
- hardness: the speed of the acoustic wave through the seabed material indicates its nature. Low speeds usually mean soft, weakly reflective sediment; high speeds often mean bare, highly reflective rock;
- roughness: if the transmitted pulse is short enough, the seabed echo briefly sweeps a ring-shaped area around the vertical point of impact. How the amplitude changes during this sweep indicates the local seabed: a smooth seabed gives a short response, limited to the specular point; a rough seabed gives a response spread out in time.
In Olex, the 2D and 3D relief is coloured by hardness, from dark purple for soft seabeds to light yellow for hard seabeds. The palette adjusts automatically or by hand, to make some areas easier to read. An index from 0 to 100% quantifies hardness. The seabed profile window also shows hardness in colour, for example to analyse sand ridges.
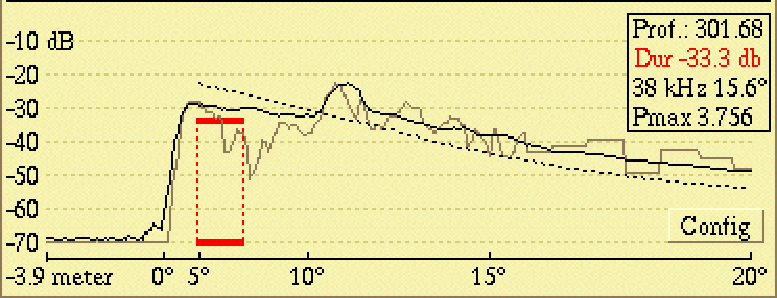 Echo signal and hardness index
The echogram linked to the chart
- With a simple action on the Ex60, the echo image and data shown by the echo sounder are recorded in Olex.
- The echogram is thus linked to the vessel’s track, and therefore georeferenced on the chart.
- The digital process, derived from technologies developed for scientists, allows very fine analysis.
- The skipper can replay, like a video recorder, the vessel’s position on the chart and the echogram over several hours, as with the old paper echo sounders.
- Olex uses the raw transducer measurements digitised by the Ex60: users can change the depth scales and the gain in Olex to analyse a track better during replay.
Examples of Olex used with Ex60 echo sounders:
- fishing in Cornwall (Falmouth), where some forty local fishermen adopted Olex with an EQ60 or ES60;
- mapping of Lake Seljordsvatnet, Norway, by the GUST team (EK60 and Olex);
- acoustic observations of orange roughy schools on the Cascade Plateau, south-east of Tasmania, on board the Petuna Explorer in June and July 2003, by Australia’s CSIRO (ES60 and Olex);
- acoustic biomass measurements at the Institute of Marine Research in Bergen (Norway) and at NOAA (United States).
Other acoustic seabed classification systems
The shape of the returning echo reveals the nature and fine geometry of the seabed: the harder the seabed, the stronger the echo amplitude; the rougher it is, the more the echo is spread out. Acoustic ground discrimination systems (AGDS) work in different ways: envelope of the first echo (QTC, Quester Tangent), first two echoes (VBT, Biosonics), volume scattered in one echo (CH1-CH2, MPO), acoustic impedance difference (Elac, ASCS Stennis). Most can be fitted to several transducers and analyse several frequencies at once.
The colour display of seabed type in 2D and 3D in Olex is also compatible with the RoxAnn and Echoplus Seascan systems.
These two systems analyse two successive echoes from the same ping: the first after reflection on the seabed, the second after a double surface-seabed path. The spread of the first echo (E1) measures signal dispersion, linked to seabed roughness relative to the wavelength. The amplitude of the second echo (E2) measures reflection, linked to substrate density (impedance). The acoustic samples, integrated over a few pings (from 2 seconds to a minute), are plotted on a hardness (E2) / roughness (E1) chart, then grouped into acoustic classes. RoxAnn splits these classes into predefined E1-E2 rectangles for known materials and works on the analogue signal. Seascan (like QTC) works on the digitised signal: a simplified digital version of RoxAnn, it adjusts automatically to the echo sounder frequency, the pulse length and energy, and the depth.
They differ from the Simrad solution:
- in technology:
- RoxAnn and Seascan measure, in mV, the time-integrated signal strength of the multiple echoes to derive a roughness index (E1) and a hardness index (E2);
- Simrad echo sounders digitise the main echo and apply many waveform interpretation algorithms to it, without using multiple echoes.
- in how they work with Olex:
- RoxAnn and Seascan, added to the vessel’s echo sounder, send their data over a serial link. Olex uses them as they are, only filtering values close to the minimum or maximum (a sign of a badly calibrated or saturated system). The echogram cannot be recorded. Roughness and hardness values (from 0.000 to 9.999 mV) vary widely with the echo sounder and transducer (power ranges from 100 W to 10 kW): they mean nothing in absolute terms; what matters is how they change between soft and hard seabeds. They also depend on calibration, to be done carefully over sandy seabeds to obtain the widest range of E1 and E2 values;
- Simrad echo sounders send their raw data to Olex over Ethernet. Olex can then display an echogram linked to the vessel’s track and apply editing and quality-control procedures to the measurements.
The shape of the echo depends on the frequency, pulse length, beam width, and the density and roughness of the seabed. Manufacturers recommend, for example, a 33 kHz transducer over sandy seabeds at 30 to 50 m, and 200 kHz over a muddy seabed in a harbour. The signal also depends on depth, vessel speed and sudden changes in relief, which stretch the echo, all the more so as the echo sounder beam is narrow.
These systems have their limits: discrimination between substrates, sensitivity to roll and pitch. They nevertheless give good results in seabed characterisation studies when a resolution of a few tens of metres is enough and habitats are few. They estimate seabed variability, but sampling is still needed to qualify the substrate.
Updated : October 2026