Comparison
This argument compared Olex with the other navigation and bathymetry software on the market, especially for real-time 2D and 3D bathymetry. It was written for the former website during the first years of Olex distribution in France, which began in 2000: the configurations, competing software and data mentioned are those of that time.
The strengths of Linux
Many of the advantages of Olex came from Linux, its operating system:
- greater reliability, thanks to the regular auditing of its code;
- cheaper hardware, since Linux needs less computing power;
- less maintenance: fewer interventions to change versions or restart the system after a failure;
- greater openness, with non-proprietary file formats;
- savings on operating system licences and their updates.
1. Reliability
- Besides navigation aids, Olex has offered automatic real-time bathymetry since 1998, a complex function to implement: it was the pioneer in this field.
- At the time, hundreds of boats were equipped with it in France and around the world (Norway, Iceland, Denmark, Sweden, Spain, Scotland, Ireland, Canada, United States, South Africa…).
2. A simpler, more efficient environment
Configurations compared at the time:
| Competing software | Olex | |
|---|---|---|
| Operating system | MS-DOS or Windows (98, 2000 or XP) | Linux (Red Hat or Mandrake) |
| Minimum PC | Pentium III at 700 MHz | Celeron at 433 MHz |
| RAM | 128 MB minimum (256 MB recommended) | 64 MB minimum (128 MB recommended) |
| Video card | 32 MB accelerated graphics card | no accelerated graphics card |
| Hard disk | 20 GB | 10 GB |
Olex needs no particular PC and no special graphics card for 3D. This is due to Linux, reputed to perform better than proprietary systems such as Windows.
3. A different operating principle
This is a very important argument. Other systems start from an existing database and modify it with the measurements from the boat’s GPS and echo sounder.
In MIS’s view, in some regions the position of the hydrographic data shown on official nautical charts is not accurate enough for fishing. It is better to take advantage of GPS accuracy to build bathymetric charts directly from the ship’s sensors.
On this subject, see SHOM’s Lettre aux navigateurs: no. 17 (December 2000), article by Serge Lannuzel on the accuracy of the hydrographic data shown on nautical charts; no. 14 (December 1997), on understanding the nautical chart; no. 15 (December 1998), on the cartographic generalisation of bathymetry. See also the SHOM book L’hydrographie, les documents nautiques et leur bon usage (1997 edition).
Nautical documents, intended first for navigators, are simplified hydrographic documents: they show only part of the surveys, to remain readable (main depth contours). SHOM’s bathymetric survey sheets, on the other hand, contain only bathymetry: they give the actual soundings recorded (along survey lines), corrected for the tide, and are used to compile navigation charts. For example, over an area of about 20 km², a survey sheet has about 6,000 soundings (one every 50 m), against about 500 on a 1:10,000 bathymetric chart (one depth value every 200 m).
Which databases did the competing software use?
Soundings from vector charts (C-Map CM93 edition 2)
- Trials compared, in Norway and France, C-Map CM93 charts (among the most accurate in their worldwide catalogue) with the data recorded by boats. They showed that the soundings on these charts remain far too inaccurate and contain many errors.
- The further from the coast, the sparser these soundings become: for an offshore bathymetric study, there are far too few of them.
- Some competing software treated C-Map data as personal data, impossible to distinguish from the data recorded by the boat or imported.
Olex therefore chose not to integrate the soundings of CM93 vector charts, so as not to distort the boat’s own surveys.
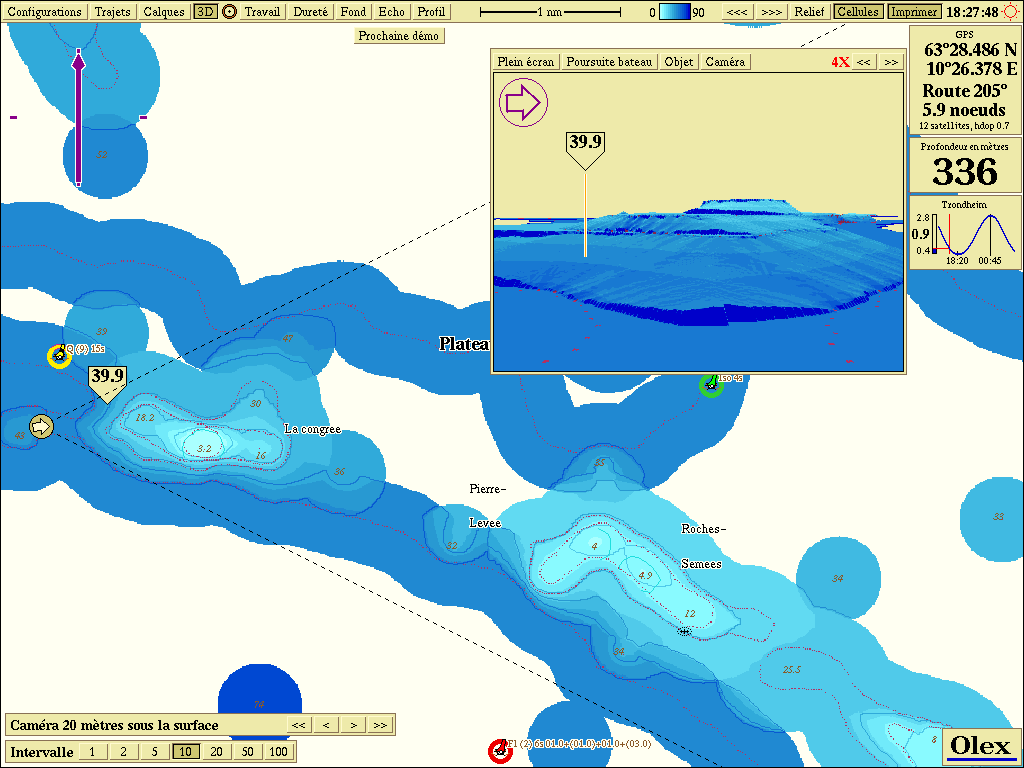 3D view built only from the soundings of vectorised charts (Rochebonne, Bay of Biscay)
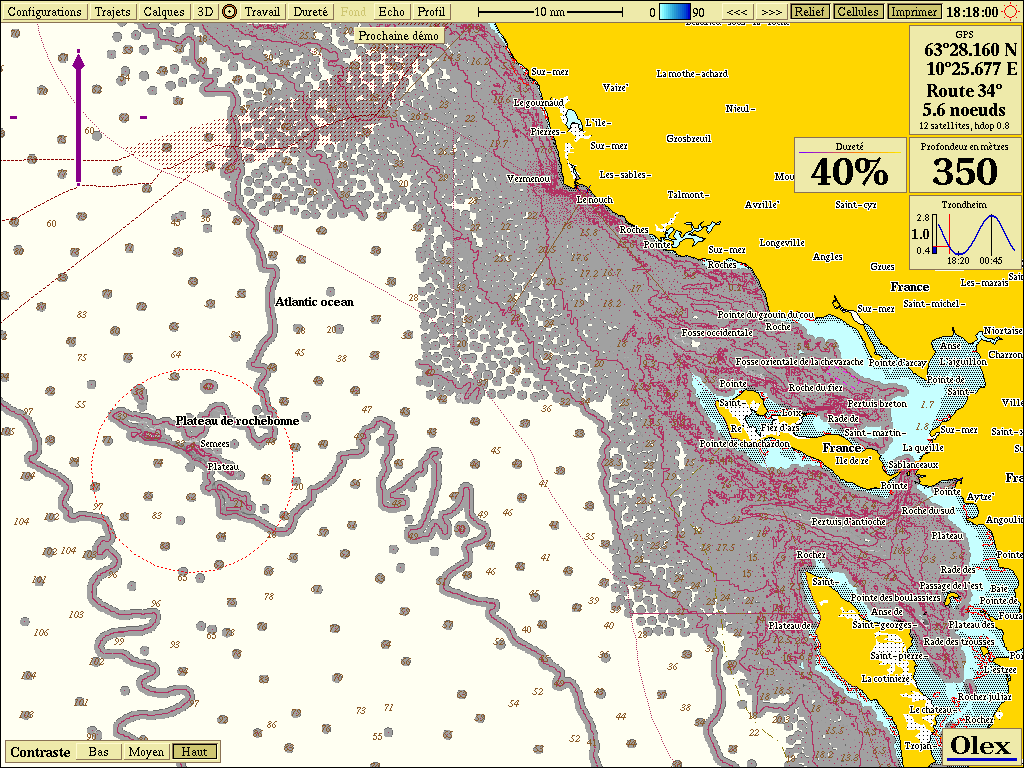 Relief computed only from the soundings of vectorised charts
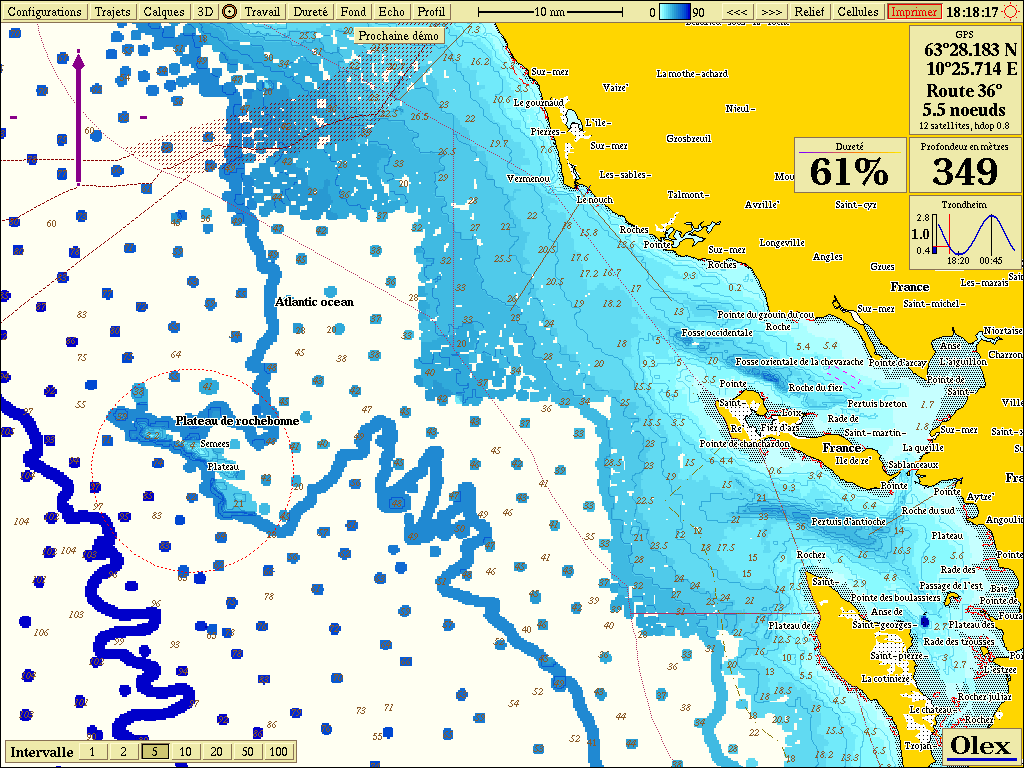 Depth contours computed only from the soundings of vectorised charts
Gridded digital terrain models (DTMs)
A DTM is a mathematical representation obtained by interpolating the raw measured data: a grid of regularly spaced points giving a general picture of the terrain.
SHOM public DTMs. At the time, the whole French exclusive economic zone (EEZ), i.e. 340,000 km², was available as public data at a resolution of one minute (about one nautical mile). But only 20% of the zone, i.e. 70,000 km², was available at 0.1 minute, in two regions:
- South Brittany: 4 zones of 1° by 1° (from 48° N 4° W to 46° N 2° W);
- Cotentin and Baie de Seine: 6 zones of 1° by 1° (from 51° N 2° W to 49° N 1° E).
These DTMs do not meet the needs of fishing skippers well, because they are not detailed enough: the best resolution of SHOM’s public DTMs, a 0.1-minute grid, corresponds to a spacing of about 185 m. Where no database exists, some competing software only have the ETOPO5 global model, with a resolution of 5 minutes, i.e. a grid of about 9,000 m.
| SHOM | NOAA | |
|---|---|---|
| Data | DTM in .grd format (BDBS, Hydrostore server) | DTM in .grd format (xyz), chart 16531 Krenzan Islands |
| Location | Baie de Seine | Derbin Strait, Alaska |
| Grid resolution | 0.1 nautical mile (185 m) | 50 m |
| Scale | 1:20,000 | 1:5,000 |
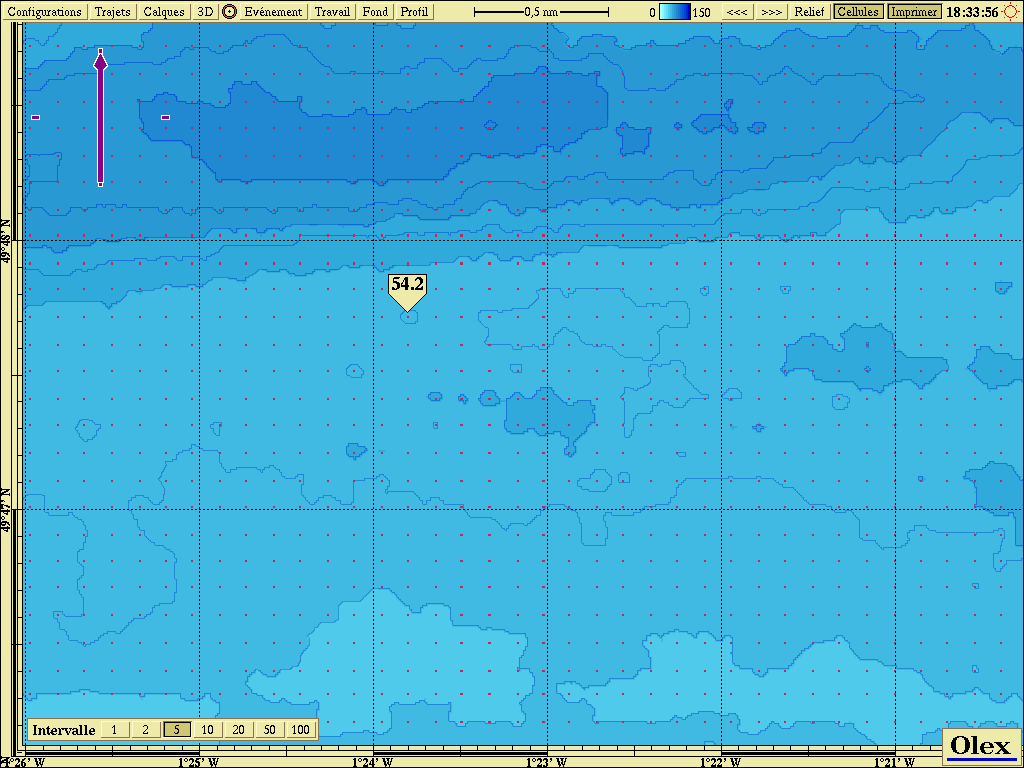 SHOM DTM, Baie de Seine: 2D view
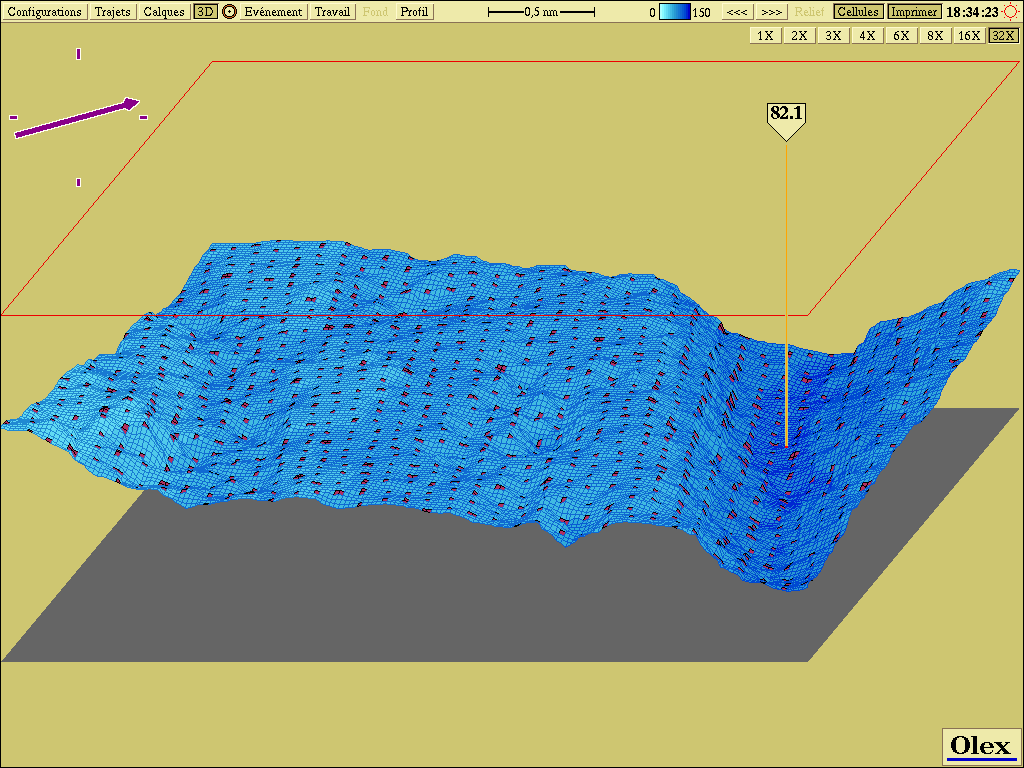 SHOM DTM, Baie de Seine: 3D view
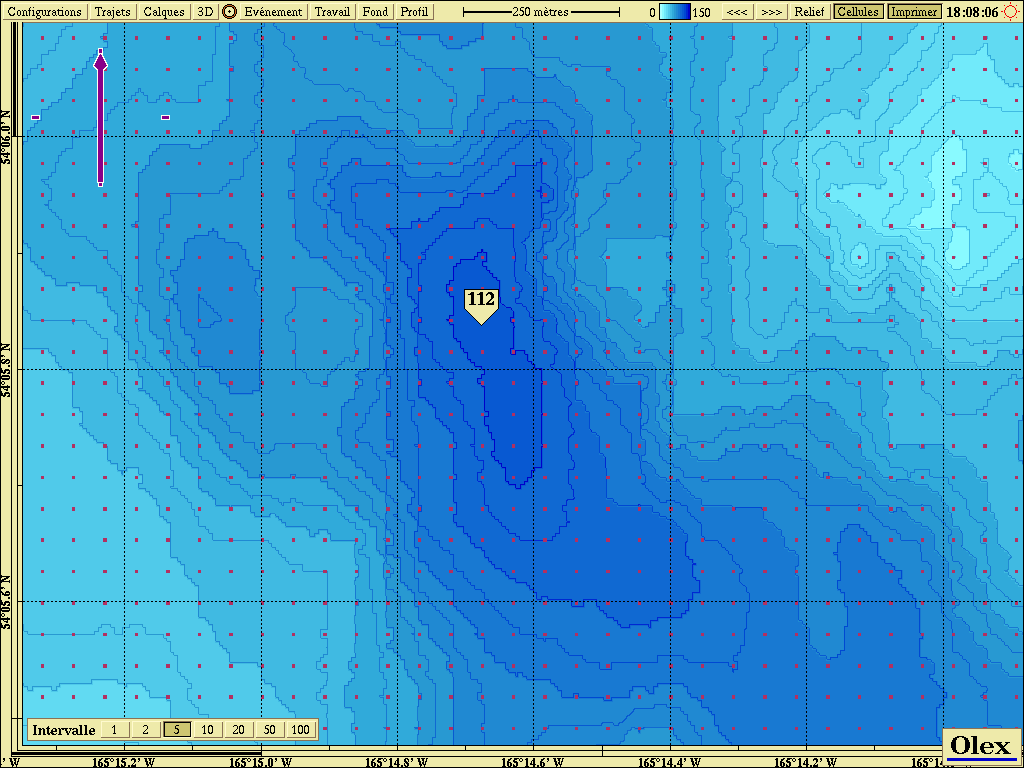 NOAA DTM, Derbin Strait (Alaska): 2D view
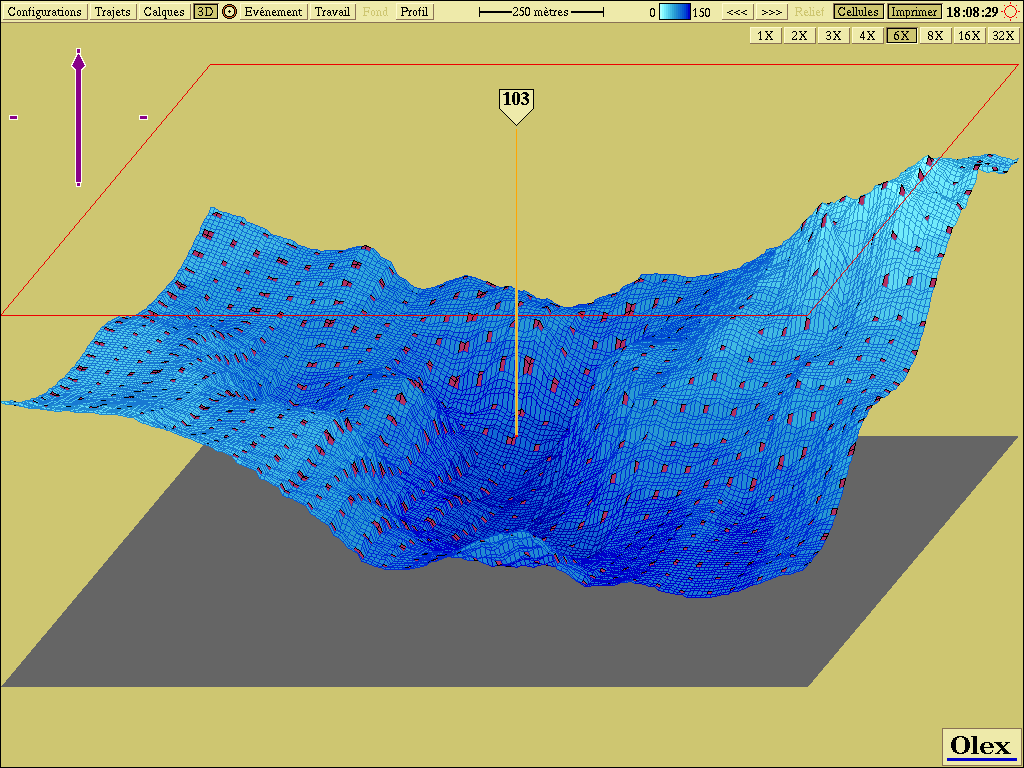 NOAA DTM, Derbin Strait (Alaska): 3D view
Ifremer DTMs. Processing the data of Ifremer’s multibeam echo sounders (such as the EM12D deep-water echo sounder of the Atalante) produced several DTMs:
- Six DTMs with a 200 m grid cover deep-sea fishing grounds worked by French trawlers on the continental slope (roundnose grenadier, orange roughy, black scabbardfish, siki deep-water sharks) down to about 1,200 m in the north-east Atlantic. This is Ifremer’s Cartopep project, part of the EEC-funded Pesca programme: a survey of part of the continental margin west of Scotland (including the Hebrides Terrace) and Ireland. Their resolution is not quite suited to fishing, but they help define working areas in waters where bathymetric data are very scarce, before building finer bathymetry with Olex over the areas being fished.
- The six DTMs produced in 1999 by Ifremer’s bathymetric and acoustic imagery synthesis of the north-east Atlantic EEZ were not yet public. Their grid had to respect defence interests and the memorandum of understanding between the French Navy and Ifremer: in principle no finer than 500 m, unless the Navy agreed. The same applied to the DTMs of the western Mediterranean (1998) and the Ligurian Sea (1997).
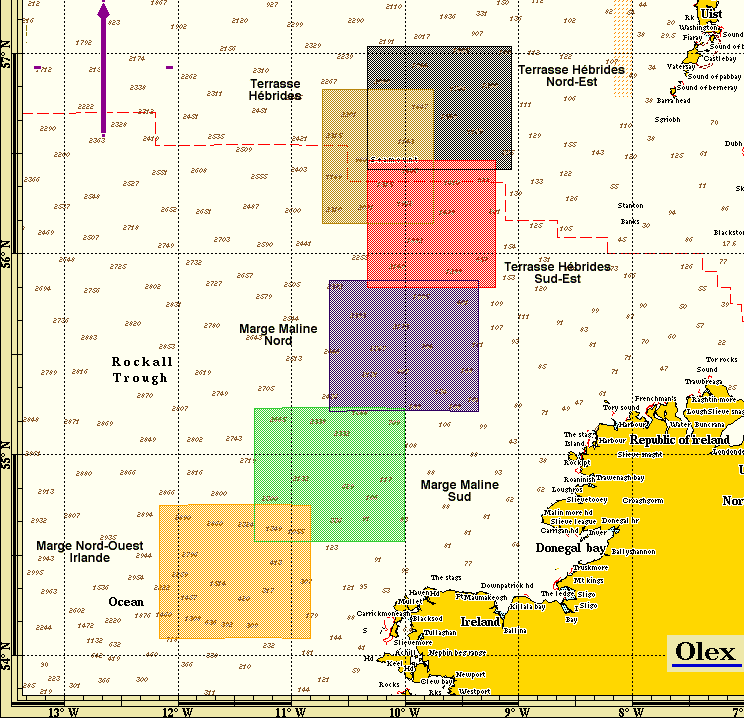 The 6 zones of the Cartopep project (Ifremer)
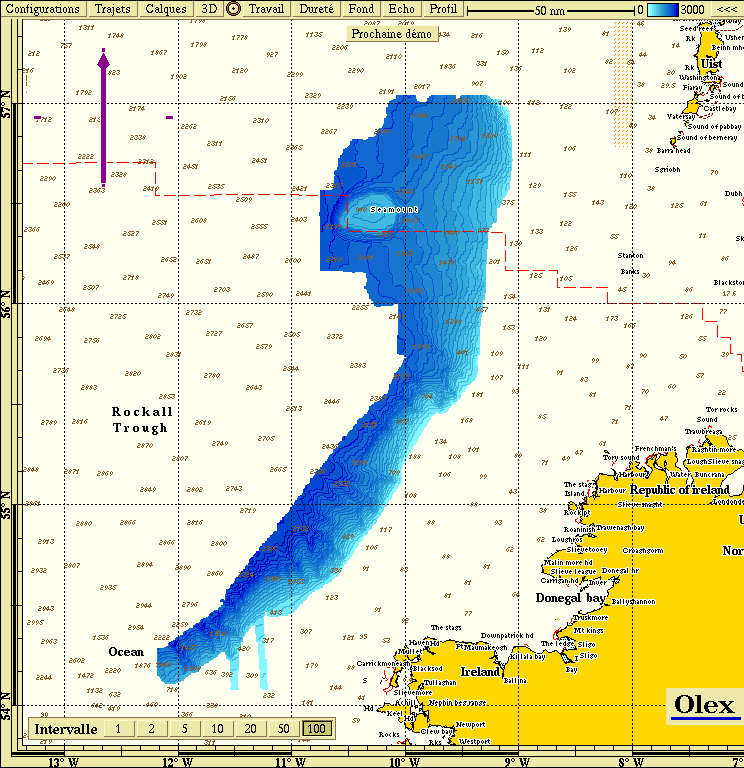 Depth contours of the Cartopep zones
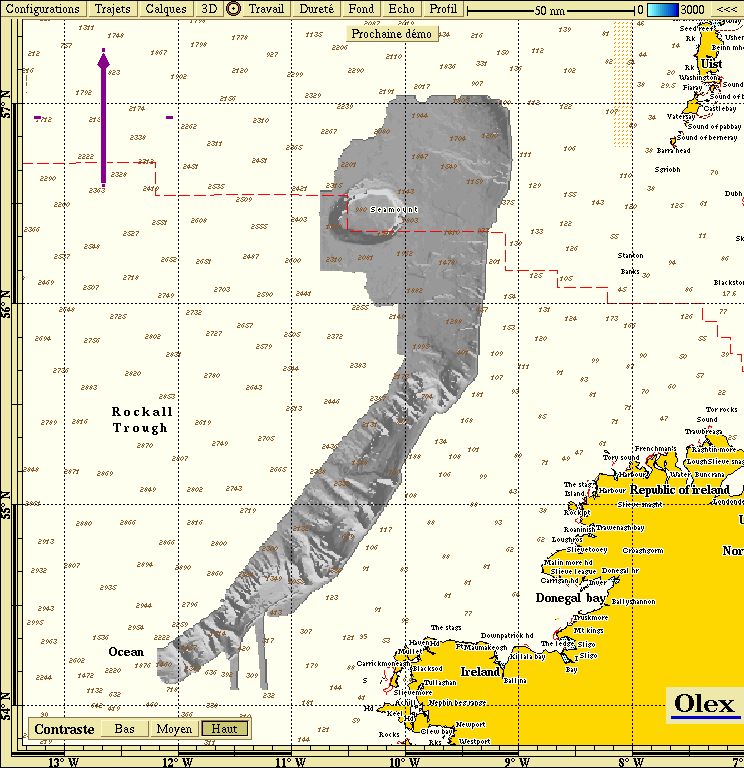 Relief of the Cartopep zones
Ifremer’s marine geosciences department also produced a bathymetric synthesis of the north-east Atlantic and the Bay of Biscay, using all available single-beam and multibeam data. Its public DTM, with a 1 km grid, was imported into Olex: 4.42 million xyz points.
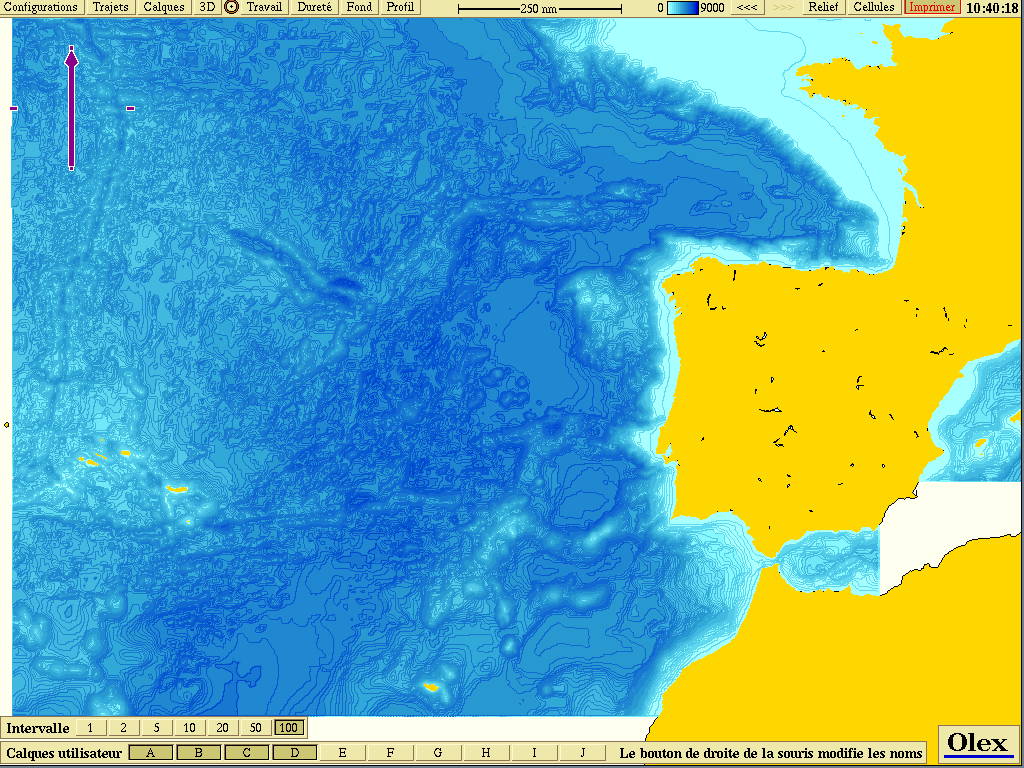 Ifremer synthesis: depth contours
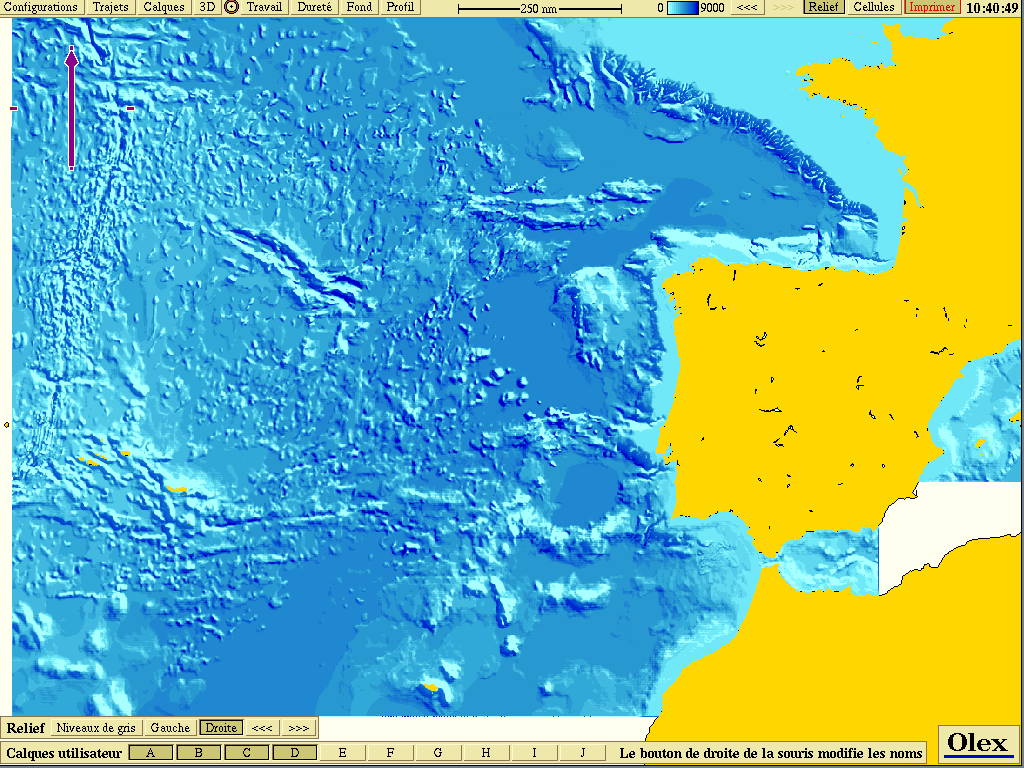 Ifremer synthesis: relief
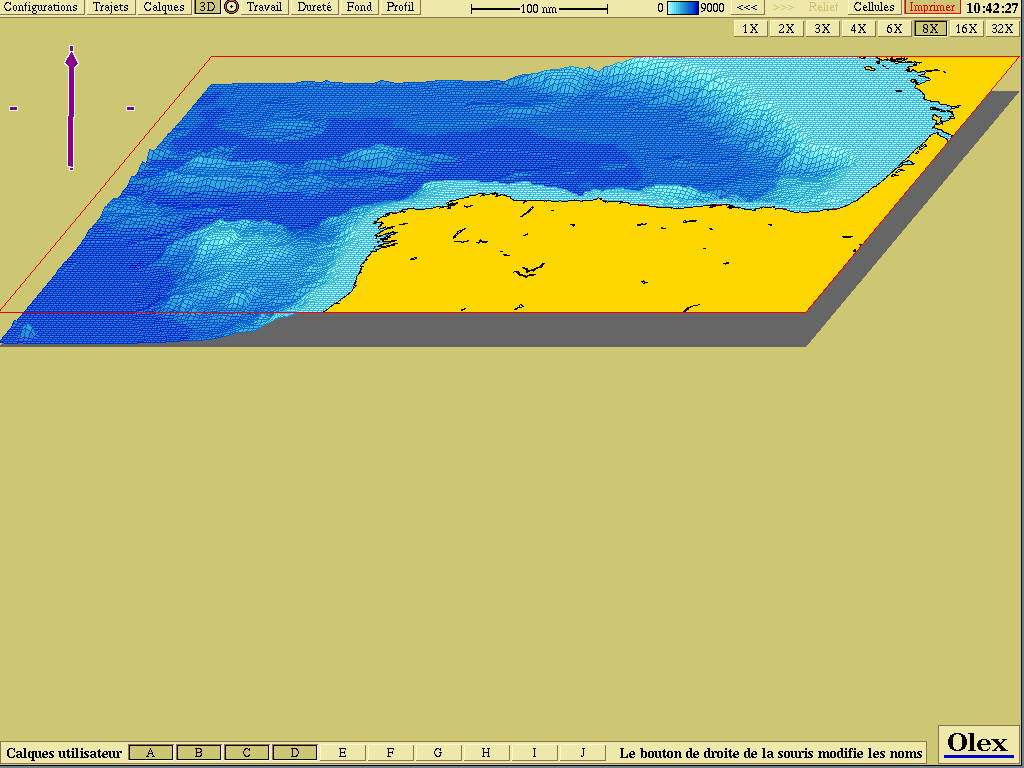 Ifremer synthesis: 3D view
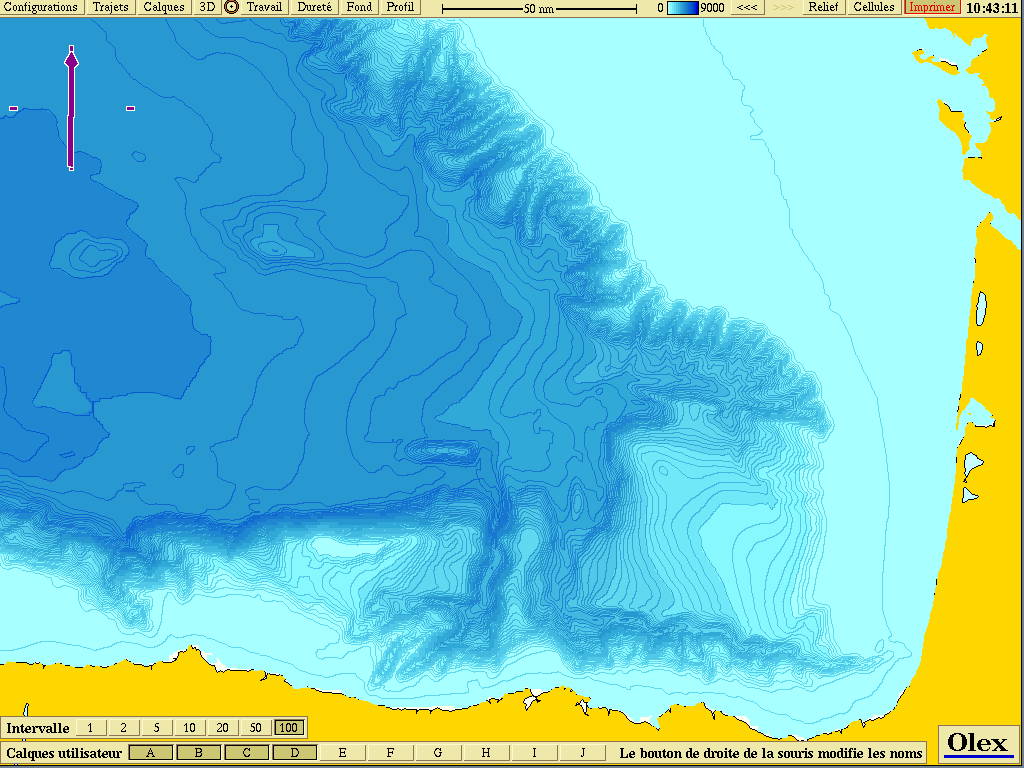 Ifremer synthesis: Bay of Biscay
Other DTMs were imported into Olex:
- the morpho-bathymetry of the Mediterranean (CIESM and Ifremer), with a 1 km grid: 1.265 million soundings;
- the bathymetry of the New Caledonia EEZ (Géorep), with a 500 m grid, from the oceanographic surveys of Ifremer and IRD under the ZoNéCo programme: 5.34 million soundings.
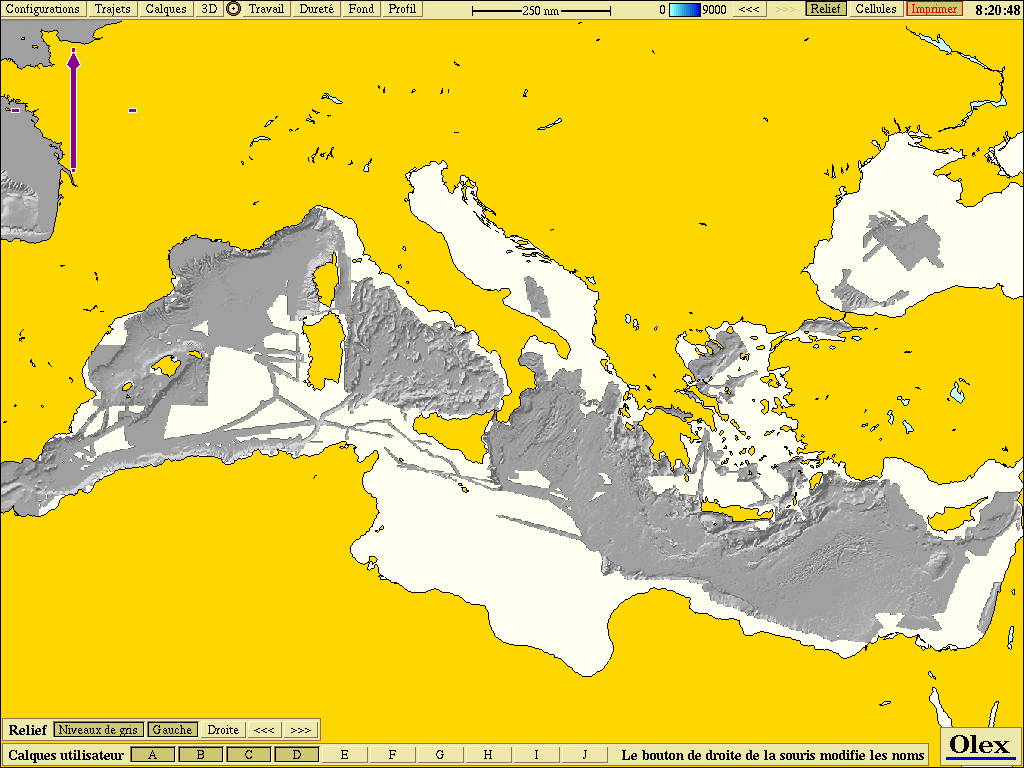 Mediterranean: relief
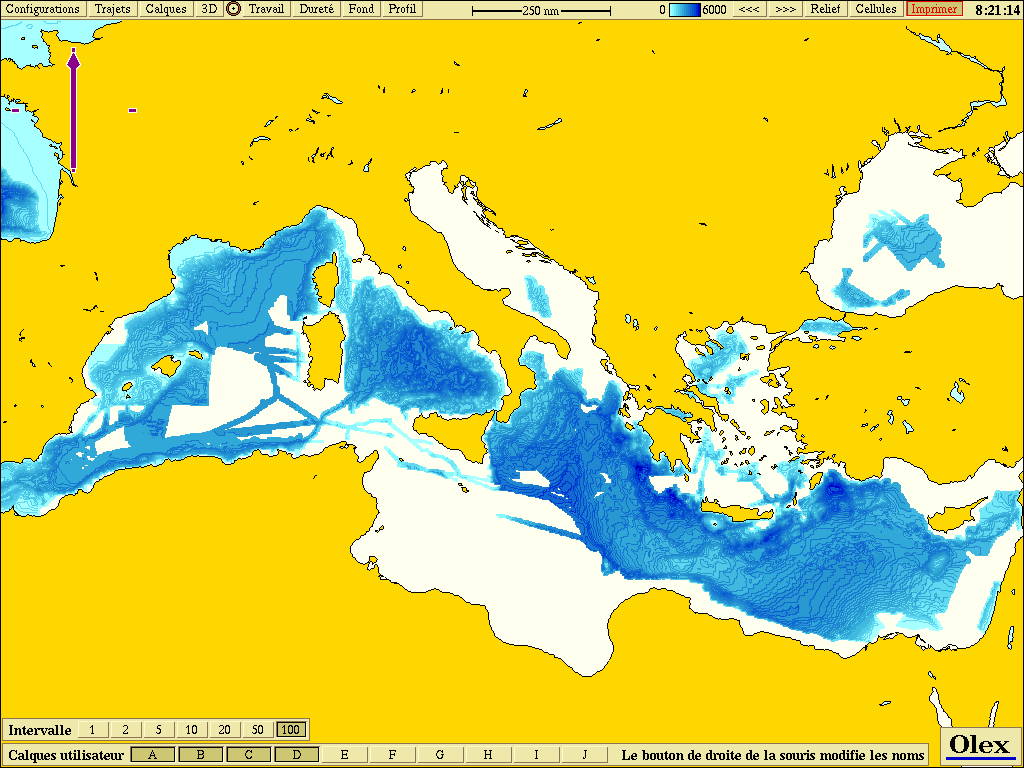 Mediterranean: depth contours
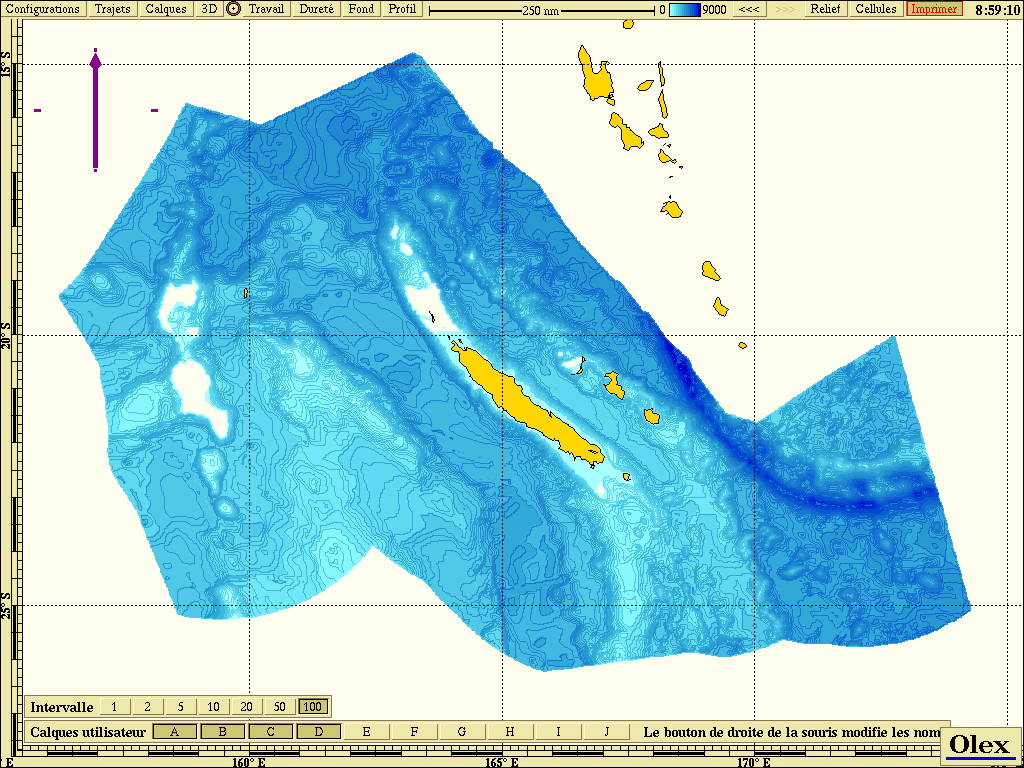 New Caledonia: depth contours
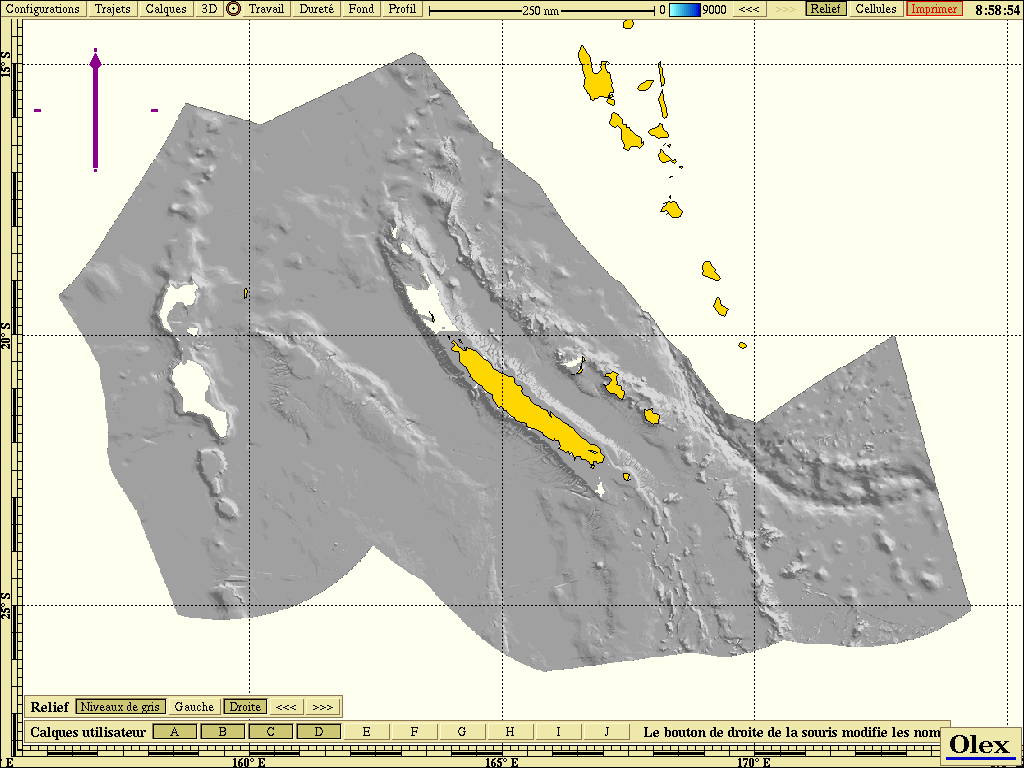 New Caledonia: relief
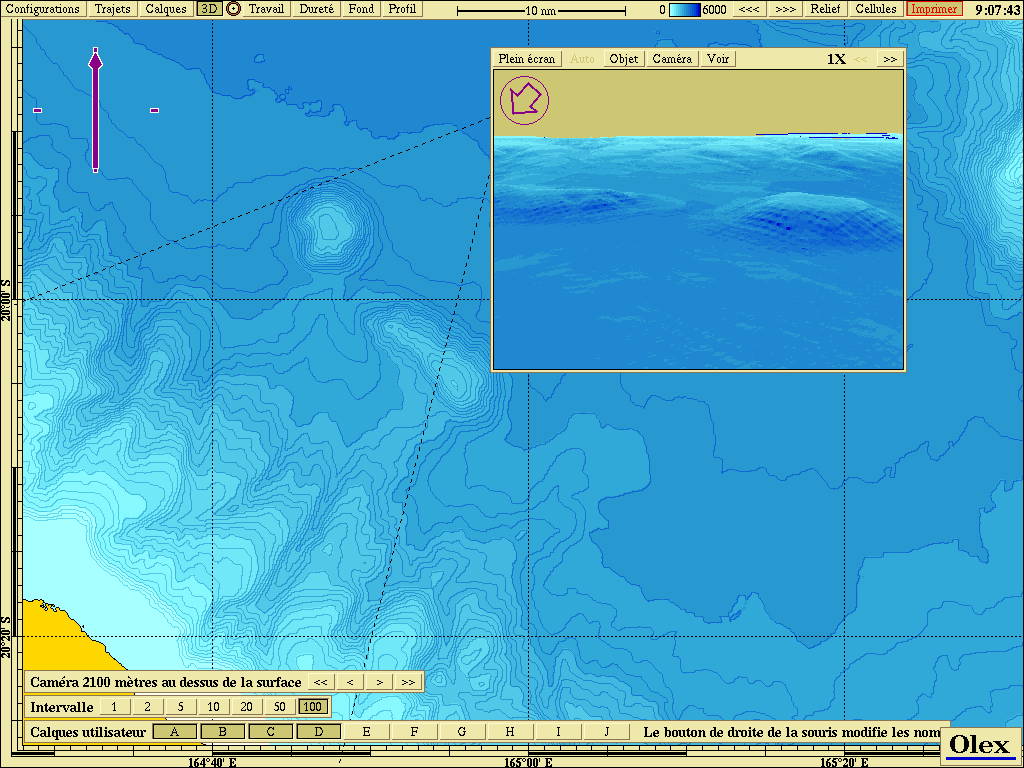 New Caledonia: detail
Personal files (stored fishing plans)
Some software imports data recorded by the boat before the bathymetry module was installed (provided the depth was recorded with the GPS position), or by other navigation systems. This feature is useful but tricky, because the nature of the imported data must be taken into account:
- Positioning. Some data come from old systems: hyperbolic systems (Decca, Toran, Loran) or first-generation GPS, whose accuracy was closer to 30 to 100 m than to the 5 to 10 m of DGPS. Yet nothing in these files indicates which positioning system was used.
- Datum. GPS records do not say which geodetic datum was used (a limitation of the NMEA 0183 standard). The Olex bathymetric database, like those of competing software, must be in WGS84. At the time, however, the vast majority of French fishing plans were recorded in ED50, the datum of SHOM paper charts before 2001. Without prior conversion, an error of about 150 m on the French coast is added to the imported data (see SHOM’s Lettre aux navigateurs no. 16, December 1999, on nautical charts and geodetic systems).
Olex works on the principle that GPS accuracy, since May 2000, is the only guarantee of reliable positioning of the recorded soundings. Olex therefore needs no initial database to work. Importing user files (from DGPS positioning, converted to Olex format, or from DTMs) remains possible, with the reservations above.
Technical limits. Some competing software imported personal data at an “import scale”, to limit calculations and avoid filling the hard disk. This technique heavily smooths the measured data: users had to work at large scales (beyond 1:10,000), and the real resolution of the resulting bathymetric database could not be known.
Olex does not have this problem: its geographic database, with Linux’s real-time compression and decompression, places no limit on recorded or imported data. For example, a user equipped with a sub-metre DGPS built a bathymetric database with a resolution of 1 m by 1 m (instead of the default 5 m by 5 m), displayed accurately down to 1:100 in 2D and 3D.
Another example: Olex AS, in Norway, collected the bathymetric data of about forty users. The result: a database of 3.5 billion soundings, of which about 25 million were measured (one measured point for 140 calculated), over more than 100,000 km², with 5 m between points. On the hard disk, this database took up only 890 MB.
In addition, some software did not take the tide into account when importing, which limited its use to offshore waters. And the scanned charts (raster copies of paper charts) offered by some competitors are only used for 2D display: they play no part in building the bathymetric database.
In conclusion: thanks to its geographic database, which allows a grid of 1 to 5 m and an unlimited number of soundings, Olex recommends using only data recorded on board. In MIS’s view, the general database supplied by competing software with their bathymetry module, besides the sales argument (“you start with something”), masked the weaknesses of their bathymetric database, both in resolution and in the volume of data handled.
4. Improving survey quality
Despite the filters applied upstream, recorded soundings contain more or less gross errors: signal reflection from the surface, bad weather (sea noise and a low signal-to-noise ratio), turbulent flows creating bubbles in front of the transducers…
They must be detected and removed. But with 5 m by 5 m cells by default, there are so many soundings to check that manual validation becomes unrealistic. Olex therefore includes algorithms for the automatic detection of doubtful soundings, which save time without sacrificing quality. They rely on local modelling of the seabed and on an assumption of topographic continuity: geostatistical techniques test the consistency of each sounding with its neighbours, and a large gap between measured and estimated depth flags a probably wrong sounding.
Olex offers two algorithms:
- “pyramidal”: it compares the vertical angles formed by the data points and detects the grossest errors, with very few false detections if the threshold is strict enough. “Hollow” or “bump” angles exceeding an adjustable threshold are flagged. Best for isolated errors on a fairly flat seabed.
- “sum of both sides”: it compares the angles formed by the points along a line running through them, and looks for large depth deviations relative to the local variability of the seabed. Best for multiple, smaller errors on a seabed with highly varied relief (steep or undulating).
The user chooses the algorithm and adjusts a single parameter. Validation remains interactive: doubtful soundings are displayed, the user decides whether to reject them, and the interpolation is recomputed with the remaining soundings. Processing is very fast.
These algorithms were tested on various bathymetric data sets and proved effective whatever the depth and relief. At the time, no competing software offered an equivalent tool.
5. Ease of use
Olex can be mastered in the first few hours: its function buttons, rather than menus and sub-menus, make it immediately understandable. Its bathymetry needs no setting up: it is fully automatic and works as soon as the computer starts.
With some competitors, on the contrary, users had to:
- create the bathymetric database;
- import the base data;
- set the interval, in seconds, between two imports into the database, to lighten the calculations. With Olex, there is no interval to set: it takes all the sensor data, at the rate set on the instruments;
- save the database manually. With Olex, saving the bathymetry, like the fishing plans, is automatic and in real time: even after a power cut, no data are lost;
- choose the reference port for the tide manually. With Olex, tidal correction is automatic.
6. Powerful 2D/3D analysis tools
- Seabed profiles between points chosen by the user.
- Display of a depth range to highlight slopes.
- Scales always shown in 3D. The larger the scale of the 3D view, the more detail it shows; but users also need to know the real scales and be able to measure bearing and distance between two points. Some competitors displayed the seabed with no scale or distance reference, which could be confusing, as the scales of depth, area and boat were out of proportion. With Olex, users always know the chart scale, the distances between objects in the 3D scene and the vertical exaggeration; in addition, the boat is drawn to scale when zooming in closely.
- Multitasking: bathymetric data can be imported in the background while real-time bathymetry is being recorded and the boat is navigating.
- Speed: even on an entry-level PC without an accelerated graphics card, calculation and display are surprisingly fast compared with competing systems that required high-end hardware.
7. User data: an open format
- Automatic plan management. Other systems managed fishing plans as files: they had to be named (often with short names) and stored in folders. In practice, copies of plans ended up in several folders, sometimes updated instead of the originals. Olex does away with file management: users enter their marks, lines and areas without worrying about saving them. Everything is stored in a geographic database and displayed over the relevant area, since the software was first used. Layers let users show or hide some of the data. Each entry is immediately saved to disk: nothing is lost, even after a power cut.
- Tracks archived by date and place. Users can bring back, in chronological order, every trip made in an area since Olex was put into service on board.
- An open file format. Proprietary formats hinder data exchange between systems, make transfers costly and raise fears of losing years of work when changing software, or if the developer disappears. Olex was the first system to adopt an open format: a plain text file, readable in any text editor or spreadsheet, which other applications can process. The data thus remain usable, whatever software created them.
Olex is best known for real-time bathymetry, but its users soon discover how simple and powerful its plotter and fishing plan functions are. Some have even moved the entry of their fishing plans to it.
8. Echogram and seabed type
- Olex was the only system to store the echo sounder’s echogram linked to the ship’s track: users can replay the boat’s position along its track and review the echo sounder image, adjusting the gain if needed.
- The seabed relief can be displayed with a colour palette that indicates seabed hardness.
- At the time, these functions relied on the Olex Ex60 module and were compatible only with the Simrad EQ60BB and ES60 echo sounders. See Seabed hardness.
9. The commercial offer
- A simple offer: many functions are standard in Olex (seabed profile, ARPA, 2D/3D modules, unlimited number of interfaces: autopilot, gyrocompass, echo sounder…); only functions that needed specific hardware were paid options.
- Updates without surprises: from the first version of Olex installed in France (2.11, in 2000) until this argument was written, all MIS customers received new versions free of charge. Current terms are on the Prices and references page.
- A lower total cost of ownership (TCO): for an equivalent configuration, Olex proved the cheapest
solution over its lifetime, once hidden costs (management, upgrades, support) were counted:
- high performance, hence inexpensive hardware;
- security and reliability, hence almost no maintenance in port (dedicated Linux application);
- simple software, hence quick training (it is designed for people who want to navigate, not to do computing);
- interfaces that are easy to connect, hence a cheaper installation;
- free updates, hence little administration;
- an open data format, hence durable data.
Updated : October 2026